Thursday, December 19, 2019

Wrapping Up - December 19th

Topics for Today:

Today we reviewed standard form and discussed our homework.  For the entire unit on linear equations, we will be looking for patterns!

I hope everyone has a relaxing and fun vacation.  I made all the boys promise to not forget everything I've taught the over the break...

See you all in the new year!

Sections Covered in Textbook:

No new material was covered today.


Resources & Tutorials:

No new material was covered today.


Assignments:

None - have a wonderful break!  See you next year!


Wednesday, December 18, 2019

Standard Form - December 18th

Topics for Today:

Our discussion about linear equations continued today.  We have already explored slope and slope-intercept form of a line.  Today, we looked at a different form - standard form.  The standard form of a line is defined as a linear equation such that

Ax + By = C
A, B, and C must all be integers.
A must be positive.

Although it's easy to visualize a line that is in slope-intercept form (the form we worked with yesterday), it's very easy to find both the x- and y-intercepts when a line is in standard form.  These intercepts are where the line crosses the x- and y-axes, when one of our coordinates is zero.  Solving the equation when substituting a zero for a value is a quick process, because multiplying by zero removes the variable from the equation.  Once we find our intercepts, it's very easy to graph our equation.

Standard form can be nice for students who are not fond of working with fractions, and we'll be using standard form when we move to solving systems of equations in the next chapter.  In addition, many of the other graphs that students will see in later mathematics classes are written in standard form with the variables all on one side of the equation.  Comfort with standard form will help students cope when they are introduced to more complicated equations.

Vocabulary: standard form of a line, x-intercept


Sections Covered in Textbook:

6-3: Standard Form (pages 298-302)


Resources & Tutorials:

1) What is the standard form of a linear equation?
2) How do you use x- and y-intercepts to graph a line in standard form?


Assignments:

1) Standard Form worksheet


Tuesday, December 17, 2019

Slope-Intercept Form - December 17th

Topics for Today:

One of the most recognizable forms of a line is the slope-intercept form.  This line form is very useful because it's easy to visualize the actual line simply by looking at the equation.  From slope-intercept form, you can tell if the slope is positive or negative, and if the slope is steep or shallow, and also it demonstrates where the line crosses the y-axis (this is the y-intercept).

We talked about what an intercept is (this word sounds an awful lot like intersect!).

I reminded students of our work on solving literal equations - this skill will be especially helpful for our unit on linear equations, as we'll be looking at three different forms for a linear equation.  To put a line in slope-intercept form, simply solve for the variable "y".

Slope intercept form looks like this:  y=mx + b

  • m is the slope
  • b is the y-intercept 
Vocabulary: linear equation, y-intercept, slope-intercept form


Sections Covered in Textbook:

6-2: Slope-Intercept Form (pages 291-296)


Resources & Tutorials:

1) What is a linear equation?
2) What is the y-intercept?
3) What is the slope-intercept form of a line?


Assignments:

1) Slope-Intercept Form Worksheet
2) Chapter 5 Test Corrections due Wednesday


Monday, December 16, 2019

Rate of Change and Slope - December 16th

Topics for Today:

We will continue our discussion about functions as we explore linear functions (lines).  ALL LINES (with the exception of vertical lines) are functions.  This unit will cover many different aspects of line, beginning with rate of change, otherwise known as slope.  We associate slope with the "steepness" of a line.  Slopes can be positive, negative, zero, or undefined.

Slope is a 2-dimensional concept.  We will see how fast something rises (goes up) compared to how fast it travels in a horizontal direction.  Slope is defined as the change in the y-coordinate divided by the change in the x-coordinate.  To calculate slope, you need any two points on a line.  It does not matter where you start as long as you start in the same place for each component.

Vocabulary: rate of change, slope


Sections Covered in Textbook:

6-1: Rate of Change and Slope (pages 282-289)


Resources & Tutorials:

1) What does the slope of a line mean?
2) How do you find the slope of a line from two points?
3) How do you find the slope of a line from a graph?


Assignments:

1) Rate of Change and Slope Worksheet.
2) Chapter 5 Test corrections due Wednesday


Wednesday, December 11, 2019

Topics for December 11th

Today We Discussed:

We did not talk about any new topics today.  Instead, we thoroughly reviewed direct variation, how to find the constant of variation, and how to write a direct variation equation.

I also provided the student with a study guide for Chapter 5.  I will not be collecting this packet for a homework grade, but students are vehemently encouraged to complete the problems to ensure they have mastered all the concepts in Chapter 5.   Chapter 5 Test will cover sections 5-1 through 5-5.

  • We did not discuss section 5-6 which deals with Arithmetic Sequences, so it will not be on the test. 
  • The Chapter 5 Review in your textbook spans pages 275-277.

Sections Covered in Textbook:

Chapter 5 - sections 5-1 through 5-5 (pages 236-266).


Resources & Tutorials:

The blog entries for chapter 5 are:

Assignments:

Study for Chapter 5 Test.  Completion of Study Guide Packet is HIGHLY RECOMMENDED!

Tuesday, December 10, 2019

Topics for December 10th

Today We Discussed:

Direct variation was the topic of today's class.  Direct variation is simply a function that can be expressed by the formula


y = kx 
where k is the constant of variation
and k ≠ 0. 


We looked at this relationship from many different perspectives: we determined if an equation represents a direct variation relationship, we derived direct variation equations, and we used the direct variation formula to solve problems.

Vocabulary: direct variation, constant of variation


Sections Covered in Textbook:

5-5: Direct Variation (pages 261-267)


Resources & Tutorials:

1) What is the formula for direct variation?
2) What is the constant of variation?
3) How do you use the formula for direct variation?


Assignments:

1) Direct Variation Worksheet
2) Quiz corrections due tomorrow
3) Chapter 5 Test on Thursday


Monday, December 9, 2019

Topics for December 9th

Today We Discussed:

Relations, functions, domain and range and evaluating functions are still the topic of the day.  We worked on evaluating functions using tables, and sketching the graph.  We worked more with evaluating functions for various domain (x) values that involve both numbers and variables.  We also used function notation to translate values into coordinate points and further practiced determining the domain and range of functions and relations from a set of points and from graphs. 


Image result for evaluating functions from graphs"
Graphic credit: https://www.mathbootcamps.com/function-notation-and-evaluating-functions/

Sections Covered in Textbook:

No new sections were covered in the book todays. 


Resources & Tutorials:

1) Evaluating a function from a graph. (video)
2) Evaluate a function from a graph.  (online practice)


Assignments:

1) Function Notation and Evaluating Functions Worksheet
2) Quiz corrections due Wednesday
3) Chapter 5 Test Thursday


Thursday, December 5, 2019

Topics for December 5th

Today We Discussed:

Today we took a quiz that covered interpreting graphs, relations, domain and range, functions and graphs. 

For the second part of class we looked at domain and range of graphs, and determining their elements by reading a graph.  We also talked about whether each graph represented a function.  Students will be expected to know the domain and range of functions for the rest of Algebra I, and this topic will be prevalent in Algebra II.

Domain: All Real Numbers
Range:  y <= 2
This is a function!

Sections Covered in Textbook:

No new sections were covered today.


Resources & Tutorials:

1) Find the domain and range from a graph


Assignments:

1) Finish Domain and Range of Graphs Worksheet if not finished in class.
2)  **Planning Ahead** - Chapter 5 Test Next Thursday, December 12th.


Wednesday, December 4, 2019

Topics for December 4th

Today We Discussed:

We continued our discussion about functions and explored how to write a function rule (basically this is an equation) from a table of values or a graph of coordinate points.  When we move deeper into linear functions, finding the slope, and graphing, we'll take a look at how to deduce a function rule that involves more than one operation.


Sections Covered in Textbook:

5-5: Writing a Function Rule (pages 254-260)


Resources & Tutorials:

1) How do you write a rule from a table? 
2) Finding the function rule from a table (more complicated examples).

Assignments:

1) Writing a Function Rule worksheet
2)  Quiz Tomorrow over Relating Graphs to Events, Relations, Functions, and Graphs


Tuesday, December 3, 2019

Topics for December 3rd

Today We Discussed:

We expanded our work on functions today with an exploration of graphing.  We discussed three different ways to view a function (as an equation, as a table, and as a graph).  We played around with linear, absolute value, and quadratic functions.

One aspect of functions that is nice is that we can pick what values to use for our domain, and this is especially helpful when dealing with functions containing fractions.  We can pick numbers for the domain that multiply to give us whole numbers, to make our graphs easier to draw.  I will continue to reinforce to students to choose wisely when picking values for the domain.

We also discussed the generic shapes of the three types of functions we talked about.  Linear functions will create a line; absolute value functions will generate a "V"; quadratic equations will generate a "U" or what is called a parabola. 

Vocabulary: independent variable, dependent variable


Sections Covered in Textbook:
5-3: Function Rules, Tables, and Graphs (pages 247 - 252)


Resources & Tutorials:

1) How do you graph a linear function using a table?
2)  Graph an absolute value function from a table.
3)  Graph quadratic function from a table.
4) 6 Mini-Coordinate Planes for Graphing


Assignments:

1) Function Rules, Tables, and Graphs Worksheet
2)  Planning ahead - Quiz Thursday over graphs and functions.


Monday, December 2, 2019

Topics for December 2nd

Today We Discussed:

Welcome back, students!  I hope everyone had a relaxing and fun break!

Today we reviewed what relations are, and reinforced the concepts of domain and range.  We also defined functions as special relations where there is exactly one range value for each given domain value.  We modeled the different ways of representing a relation:  set of ordered pairs, table, mapping diagram, and graph, and used the vertical line test to determine if a graph is a function or not.  We also discussed why graphs that fail the vertical line test are not functions.


Many students will try to "force" a relation to be a function, or will feel like it is "bad" if a relation is not a function.  We discussed this tendency, and why it's perfectly fine to have a relation that is not a function.  Just because something does not fit a particular definition does not make it bad or good - it just is what is is!

Finally, we took a look at function notation.  Most students are intimidated by this method of representing an equation in two variables.  They are mostly comfortable with an equation of the form

y = 2x + 3 

We discussed that f(x) = 2x + 3 is just a fancy way of writing the above equation, and it can be described by saying "there is some function that uses the variable x, where the function rule is 2x+3. 

We discussed evaluating functions for given domain values, to produce range values.

DIXI-ROYD was also reinforced today.

Vocabulary:  relation, domain, range, function, vertical line test, mapping diagram, DIXI-ROYD, function rule, evaluate function, function notation


Sections Covered in Textbook:

5-2: Relations and Functions (pages 241-246)


Resources & Tutorials:

1) What is a relation?
2) What is domain?
3) What is the range of a relation?
4) How do you find the domain and range of a relation?
5) What is a function?
6) How do you figure out if a relation is a function?
7) What is function notation?
8) How do you find f(x) if given a value for x?


Assignments:

1) Functions and Relations Worksheet
2)  Planning Ahead:  Quiz Thursday covering graphs, relations, and functions.

Thursday, November 21, 2019

Topics for November 21st

Today We Discussed:

We began our discussion of relations and functions today.  We will take several days to cover this first section as it contains a lot of new vocabulary, and symbolism that will take some time to get used to.  We discussed what a relation is (set of ordered pairs), what the domain is (inputs) and what the range is (outputs).  We also talked about functions which are just special relations where there is only a single output (range value) for every input (domain value).  We also talked about function rules (an equation that describes a function), and we introduced function notation.

A quick mnemonic to remember what terms are associated together is DIXI-ROYD.  A summary of terms and how they are related is shown in the graphic below.


Vocabulary:  relation, domain, range, function, vertical-line test, function rule, function notation, mapping diagram, DIXI-ROYD

Sections Covered in Textbook:

5-2: Relations and Functions


Resources & Tutorials:

We will pick this discussion back up when we return from Thanksgiving Break.


Assignments:

NONE!  Have a great Thanksgiving Break!


Wednesday, November 20, 2019

Topics for November 20th

Today We Discussed:

We began our next unit on functions and graphs.  Today we related graphs to real events, by analyzing graphs that relate to time passing.  The shape of the graph can tell a story of what is happening as time passes.

For graphs in general, we will be talking about independent and dependent variables.  Time is considered an independent variable with other variables dependent upon it.

Image result for interpreting graphs of time

Projects are due tomorrow.  Check yesterday's blog for a list of all items that should be included.  NO LATE PROJECTS will be accepted.

Sections Covered in Textbook:

5-1: Relating Graphs to Events


Resources & Tutorials:

1) Relating Graphs to Events
2) Relating Graphs to Events - another video


Assignments:

1) Pages 238-240 #'s 1-9 all; 12, 14, 16, 18-22 all
2) Projects due TOMORROW!


Tuesday, November 19, 2019

Topics for Novemer 19th

Today We Discussed:

We used today's class to finish our discussion about probability, and to work on finishing projects.  All students are encouraged to type their conclusions using Google Docs.  Reminder, the finished project should include the following items:

  • Rubric
  • Printout of Data from 3 Trials of Rolling Dice
  • Summary of Trial Data
  • Frequency Tables (4)
  • Theoretical Outcomes
  • Histogram Containing 3 Trials
  • Histogram of Trial Averages vs Theoretical Outcomes
  • ThinkSheet
  • Written Conclusion (Typed preferred)

Sections Covered in Textbook:

None


Resources & Tutorials:

1) Project Packet (if needed)
2) Discussion Questions (if needed)


Assignments:

1)  All corrections & missing assignments due tomorrow.
2)  Project Due TOMORROW!


Monday, November 18, 2019

Topics for November 18th

Today We Discussed:

We continued our progress with our dice project, and learned how to create new charts from our collected data.  For this project, we only focused on histograms/bar charts/column charts.  The completed project will have two histograms that are outlined in the project packet.


We also reviewed some practical uses of spreadsheets to gain better understanding of how and why they are used.

Finally, we discussed some of the things we learned by completing this project.  Students were given a list of discussion questions that they should use to build their conclusion document to be included with the final project.

Sections Covered in Textbook:

None


Resources & Tutorials:

1)  Class Notes:  How to Create Charts in GSheets.
2)  How to create a column chart in GSheets (Video).
3)  Dice Project Discussion Questions


Assignments:

1) Turn in any missing work, corrections by Wednesday.
2) Work on project charts, ThinkSheet, and Discussion Questions, and written conclusion.  Project due WEDNESDAY!


Tuesday, November 12, 2019

Topics for November 12th

Today We Discussed:

We continued working on our projects today and discussed how spreadsheets work. We reviewed how to use Google Drive to save our work, and made a copy of the project workbook in which to keep our own data.  We looked at some functions and equations, and got a feel for how GSheets work.

The tutorial below is an excellent beginning video for Google Sheets (GSheets), and it's sourced from YouTube.  If you click on the "SHOW MORE" link, a list of the different topics of the video and links to the exact starting points are displayed for easy reference.

We reviewed our theoretical outcomes that were generated from our sample space and their frequencies that we calculated together during yesterday's class, and worked more with frequency tables.  A frequency table is a good tool to quickly tabulate the number of times an event occurs, and an easy way to classify a large set of data.


Vocabulary:  spreadsheet, frequency table

Sections Covered in Textbook:


Chapter 4 (Omit section 4-2) - pages 181-230

Resources & Tutorials:

1) Yesterday's Blog with Links to All Lessons
2)  Introduction to Google Sheets


Assignments:

1) Chapter 4 Review
2) Continue working on Project
3) Chapter 4 Test Thursday


Monday, November 11, 2019

Topics for November 11th

Today We Discussed:

Today we wrapped up concepts in Chapter 4, and began review for our test which is on Thursday.  In addition, students were given their $1,000,000 Guess Project packet.  We will investigate both theoretical and experimental probability with two dice.  All students will need a Google account for this project.  We'll also learn about spreadsheets and create some charts from our own data.

Sections Covered in Textbook:

Chapter 4 (Omit section 4-2) - pages 181-230


Resources & Tutorials:

1) Blog Entry for Ratio and Proportion
2) Blog Entry for Proportion and Percent Equations
3) Blog Entry for Percent of Change
4) Blog Entry for Applying Ratios to Probability
5) Blog Entry for Probability of Compound Events


Assignments:

1) Get Project Packet signed - setup Google account if needed
2) Complete project data collection (3 trials)
3) **Planning Ahead** Chapter 4 Test Thursday


Thursday, November 7, 2019

Topics for November 7th

Today We Discussed:

Today we discussed probability of compound events.  We reviewed what the word "compound" means (and in this case, it simply means more than one), and discussed the different types of compound events.  There are two types:  independent events and dependent events.  Independent events occur when the outcome of one event has no effect on the other (ex:  flipping a coin twice).  Dependent events occur when the outcome of the first event does have an effect on the event that comes after (ex:  taking a card from a deck of cards and keeping it, then taking another card).

The numeric probability of dependent events can be found by multiplying the theoretical probability of each event together.

For two independent events, P(A and B) = P(A) * P(B)
For two dependent events, P(A then B) = P(A) * P(B after A)

Vocabulary: independent events, dependent events


Sections Covered in Textbook:

4-6: Probability of Compound Events


Resources & Tutorials:

1) What are compound events?
2) How to determine if your events are independent or dependent.
3) How to find probability of independent events.
4) How to find probability of dependent events.


Assignments:

1) Compound Events worksheet
2) Chapter 3 Test Corrections due Monday


Wednesday, November 6, 2019

Topics for November 6th

Today We Discussed:

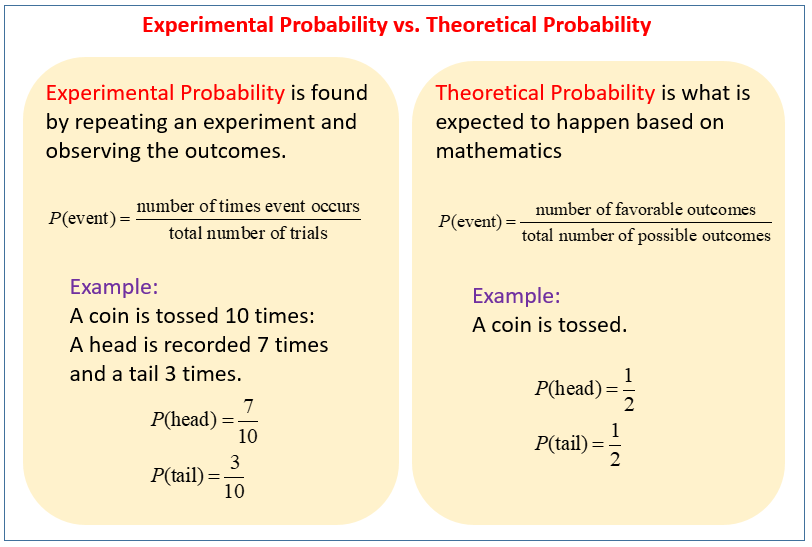
Ratios can be used to express everyday activities, and we will be using them in the context of probability.  Probability simply is the chance that an event can occur.  We defined all of the terms associated with both theoretical and experimental probability, and talked about how to find a sample space and how that relates to probability.  Exploring experimental probability is a good way to demonstrate that what we expect to happen, does not always occur, and probability is just based upon how likely something is to occur, not a guarantee it will occur.

We will be investigating experimental probability more thoroughly in the next week.

Experimental vs Theoretical Probability
Graphic Credit:  Online Math Learning

Vocabulary: probability, outcome, event, sample space, theoretical probability, experimental probability 


Sections Covered in Textbook:

4-5: Applying Ratios to Probability (pages 211-217)


Resources & Tutorials:

1) What is probability?
2) What is an outcome?
3) What is a sample space? 
4) How do you find the probability of a simple event?
5) What is experimental probability?
6) Math is Fun - Probability (not a video)
7) Probability Class Notes


Assignments:

1) Probability Assignment
2) Chapter 3 Test Corrections due Monday


Tuesday, November 5, 2019

Topics for November 5th

Today We Discussed:

We continued the topic of percents in the context of percent of change.  We can have a positive percent of change (representing an increase) or a negative rate of change (representing a decrease).  To determine the percent of change, we have to compare how much something changed to its original quantity.  Percent of change is relative to the original value.


Vocabulary: percent of change, percent of increase, percent of decrease

Sections Covered in Textbook:

4-4: Percent of Change (pages 204-209)


Resources & Tutorials:

1) What is the percent of change?
2) How do you find percent of change?
3) How do you determine percent of increase or decrease?


Assignments:

1) Percent of Change Worksheet


Monday, November 4, 2019

Topics for November 4th

Today We Discussed:

We expanded our discussion of proportions to include the percent proportion.  We deconstructed the word per-cent to mean "out of 100".  We can solve percent problems using a proportion or using a percent equation with the percent expressed as a decimal.

This unit will continue to explore proportions and percents, and we'll take some time to review the conversions of fractions to decimals to percents and vice-versa.  Students will be encouraged to memorize the decimal equivalents of common fractions as a time-saver.  Normally I am not a big fan of memorization, unless it serves a useful purpose - memorizing common concepts (like divisibility rules, the quadratic formula, and common numbers) can be a big time-saver leaving more time for higher order problem solving.

As we continue to explore the relationships among decimals, fractions, and percents, I plan to expand our discussion to other proportions, like circles.  We will investigate some probability in this unit, and will use our knowledge of proportions to convert fractions to degrees in preparation for making circle graphs.

Vocabulary: percent proportion, percent equation

Sections Covered in Textbook:

4-3: Proportions and Percent Equations


Resources & Tutorials:

1) What is a percent proportion?
2) How do you use a proportion to find a whole?
3) How do you use a proportion to find what percent a part is of a whole?
4) How do you use a proportion to find part of a whole?
5) What is a percent equation?
6) More Percent Equation Links


Assignments:

1) Proportions and Percent Equations Worksheet


Wednesday, October 30, 2019

Topics for October 30th

Today We Discussed:

We began our unit on solving and applying proportions today, and introduced/reviewed some important vocabulary, beginning with ratios.  A ratio is just a comparison of numbers by division.  Students have seen ratios ever since they began working with fractions.  When we talk about rates, we create a ratio of two numbers that have different units.  We have already seen rates this year, when dealing with uniform motion -  rate of speed (comparing a distance with how much time elapses). 

We also used conversion factors to convert rates.  A conversion factor is a rate that is equal to 1 (multiplicative identity states we can multiply by 1 and not change the identity of our number).   For example, a unit conversion would be 60 seconds per minute since 1 minute=60 seconds.

Finally, we used the means-extremes (cross products) property to solve proportions. 


Vocabulary: ratio, rate, unit rate, conversion factor, unit analysis, dimensional analysis, proportion, cross products

Sections Covered in Textbook:

4-1: Ratio and Proportion (pages 182-187)


Resources & Tutorials:

1) What is a ratio?
2) What are rates and unit rates?
3) What is dimensional or unit analysis?
4) What is a proportion?
5) How to solve a proportion by using cross products?


Assignments:

1) Ratio and Proportion Worksheet
2) Chapter 3 Test Tomorrow (Chpt 3 Review is good practice - pages 175-177)


Tuesday, October 29, 2019

Topics for October 29th

Today We Discussed:

Today we reviewed the topics from Chapter 3 in preparation for our test on Thursday. 

Students helped make this list of topics:

  • Literal Equations
  • Inequalities
    • Multi-step
    • Compound (AND and OR)
    • Graphing
  • Absolute Value
    • Equations
    • Inequalities
The big "take-aways" from this chapter are:
  • Equations have finite solutions; inequalities have infinite solutions.
  • When multiplying or dividing an inequality by a negative, you must flip the inequality sign to keep the truth of the inequality.
  • Absolute Value equations and inequalities have two cases: positive and negative

Sections Covered in Textbook:

All of Chapter 3 (pages 132-172) and Section 2-6 on Formulas (pages 111-114)


Resources & Tutorials:

Blog Entry about Literal Equations
Blog Entry for One-Step Inequalities
Blog Entry on Solving Inequalities using Addition and Subtraction
Blog Entry on Solving Inequalities using Multiplication and Division
Blog Entry on Solving Multi-Step Inequalities
Blog Entry on Compound Inequalities
Blog Entry on Absolute Value Equations
Blog Entry on Absolute Value Inequalities


Assignments:

1) Chapter 3 Review
2) Quiz Corrections Due Wednesday
3) Chapter 3 Test Thursday


Monday, October 28, 2019

Topics for October 28th

Today We Discussed:

We continued our discussion about absolute value but moved on to inequalities.  Just like absolute value equations, we must consider TWO cases for absolute value inequalities - the positive case and the negative case.  Furthermore, we have to analyze which direction our solutions go based upon whether we are dealing with a greater than absolute value inequality or a less than absolute value inequality.

  • Greater than absolute value inequalities function like OR compound inequalities.
  • Less than absolute value inequalities function like AND compound inequalities.  

Sections Covered in Textbook:

3-6: Absolute Value Equations and Inequalities (pages 167-171)


Resources & Tutorials:

1) How do you figure out if you have an AND or OR compound inequality?
2) How to solve an AND absolute value equation.
3) Introduction to Absolute Value Inequalities.
   (Use navigation on the left for more types of examples.)

Assignments:

1) Absolute Value Inequalities Worksheet
2) Quiz Corrections Due Wednesday
3) Chapter 3 Test on Thursday


Wednesday, October 23, 2019

Topics for October 23rd

Today We Discussed:

We moved into the next section in our book and discussed absolute value equations.  We will tackle absolute value inequalities on Thursday and Monday.

First, we reviewed absolute value and what it means - a number's positive distance from zero.  Absolute value equations add a small level of complexity because when we take the absolute value of a quantity, it will always be positive.   We can have an expression inside the absolute value bars be either positive OR negative, so we can end up with two solutions for the variable in these cases.

We must also analyze whether or not our absolute value equation makes sense.  In most cases, we will get two solutions, but there will be times when no solutions will be possible.  We need to make sure our equation is logical. 

Take for example the equation |x -2| = -3 

There will never be a case when we take the absolute value of an expression that will result in a solution that is less than 0.  By its very definition, absolute value is always positive.  

For each of these absolute value equations, we will need to consider TWO cases for each solution set:  the positive case and the negative case. We will need to solve TWO equations to get the complete solution for the variable.


Sections Covered in Textbook:

3-6: Absolute Value Equations and Inequalities (pages 167-171)
(We will only cover equations today!)


Resources & Tutorials:

1) Four steps to solve absolute value equations. 
2) Introduction to absolute value equations.
3) Chili Math - Solving Absolute Value Equations (Not a video)


Assignments:

1) Absolute Value Equations Worksheet
2) Quiz tomorrow on Solving Inequalities


Tuesday, October 22, 2019

Topics for October 22nd

Today We Discussed:

Our discussion about inequalities has moved on to compound inequalities.  We discussed the word "compound" and related it to compound words and compound sentences.  There are two types of compound inequalities:
  • inequalities using OR 
  • inequalities using AND
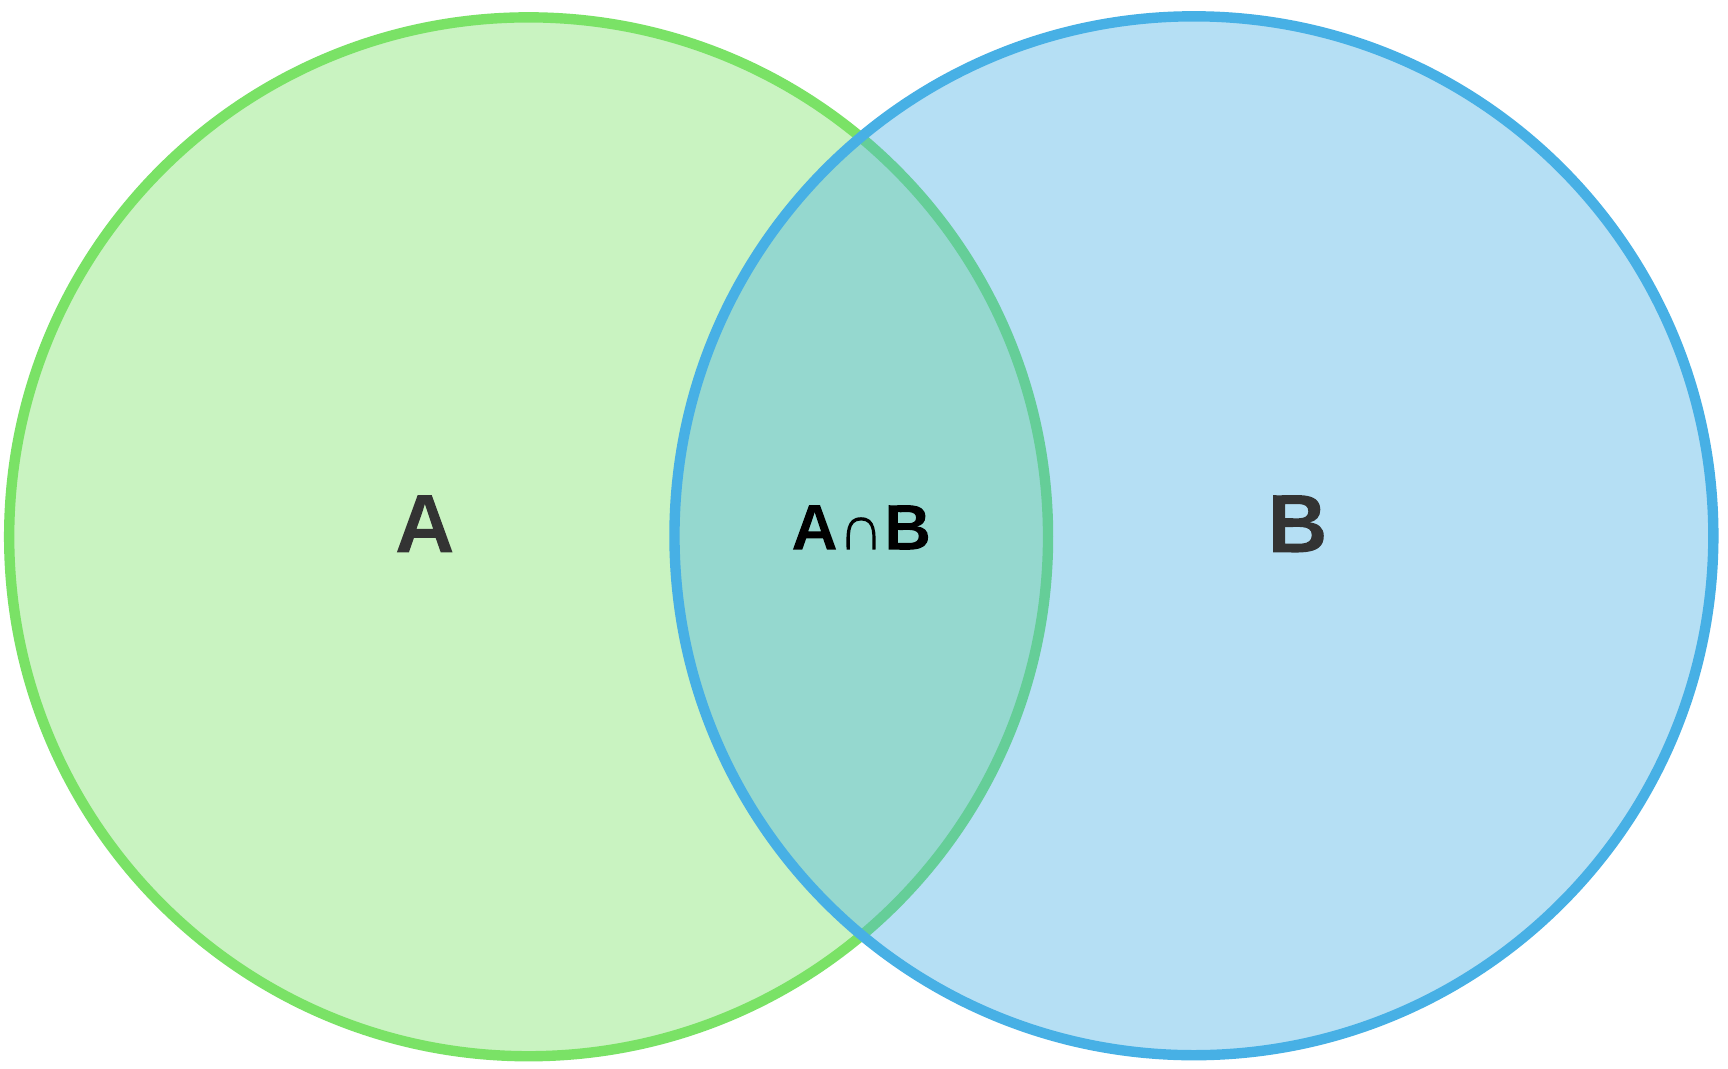
For the OR types, only part of the inequality needs to be true for the entire compound statement to be true.  For the AND types, we must have both parts true at the same time.  OR inequalities can be related to the UNION of two sets, and AND types represent the INTERSECTION (where both criteria are true at the same time).   Venn Diagrams (circle diagrams) are often used as pictorial representations of our sets. 


Sections Covered in Textbook:

3-5: Compound Inequalities (pages 161-165)


Resources & Tutorials:

1) What is a compound inequality?
2) How do you solve an OR compound inequality and graph it?
3) How do you solve an AND compound inequality and graph it?
4) How do you solve an AND compound inequality rewriting it as two?
5) What is a Venn Diagram?
6) Schoolhouse Rock - Conjunctions


Assignments:

1) Compound Inequalities Worksheet
2) Planning Ahead - Quiz Thursday (Oct 24) on solving inequalities.


Monday, October 21, 2019

Topics for October 21st

Today We Discussed:

We continue to build on our problem-solving skills with solving inequalities.  Today we moved on to more complicated inequalities that involve several steps.  Again, we approach these problems just like solving equations, with the first step being to identify the variable.  Once we identify the variable, we need to plan for how we "undo" operations performed on the variable with the goal of getting the variable by itself.  To accomplish this goal, we perform the order of operations (PEMDAS) in reverse.  *Students must always keep in mind that when multiplying or dividing an inequality by a negative number, they must reverse (flip) the inequality sign to keep the truth of the inequality.*

Sections Covered in Textbook:

Solving Multi-Step Inequalities (pages 153-159)


Resources & Tutorials:

1) How do you solve a multi-step inequality?
2) How do you solve an inequality with variables on both sides?
3) How to solve multi-step inequalities.


Assignments:

1)  Solving Multi-Step Inequalities Worksheet
2) Planning Ahead - Quiz Thursday (Oct 24) on solving inequalities.


Thursday, October 17, 2019

Topics for October 17th

Today We Discussed:

Our discussion about solving inequalities moved to solving by using the multiplication and division properties of inequality.  We solve inequalities using the same steps and procedures as solving equations, but there is one notable exception.  For cases when we either multiply or divide both sides of our inequality by a negative number, we must switch the inequality sign to preserve the truth of the inequality.  To illustrate why this works, we did a little exploration with simple inequalities in class to help understand why the "truth" of an inequality changes.

Vocabulary: multiplication property of inequality, division property of inequality

We considered the following examples in class:

Sections Covered in Textbook:

3-3: Solving Inequalities Using Multiplication & Division
       (pages 146-151)


Resources & Tutorials:

1) What is the division property of inequality?
2) What is the multiplication property of inequality?
3)  Solving inequalities using multiplication and division
4) Virtual Nerd Page with more tutorials.
5) Class Notes: Solving Inequalities by Multiplication or Division


Assignments:

1) Solving Inequalities Part II Worksheet
2) Planning Ahead - Quiz next Thursday (Oct 24) on solving inequalities.


Wednesday, October 16, 2019

Topics for October 16th

Today We Discussed:

Now that we understand what inequalities and solutions to inequalities are, we can now move into solving them.  When solving simple inequalities using addition and subtraction, we basically follow the same steps we use for solving simple equations.  For these problems, we will use the addition and subtraction properties of inequality to "undo" operations performed on a variable with the goal of getting the variable by itself.  Checking solutions to inequalities may not always locate our mistakes since there are an infinite number of possible solutions we can use to check ourselves.  Students will be encouraged to try out multiple possible solutions when checking.

Vocabulary: equivalent inequalities, addition property of inequality, subtraction property of inequality.

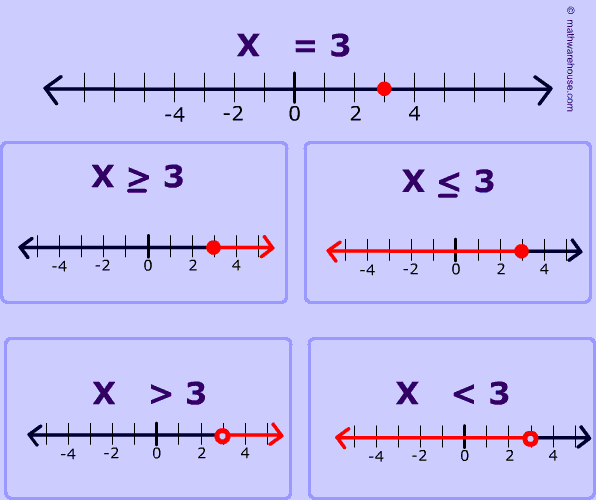
Picture of graph of Inequality on a Number Line
Graphic Credit:
https://www.mathwarehouse.com/number-lines/graph-inequality-on-number-line.php#examples1


Sections Covered in Textbook:

3-2: Solving Inequalities Using Addition and Subtraction (pages 140-144)


Resources & Tutorials:

1) What is the addition property of inequality? 
2) How do you solve an inequality using subtraction?
3) How do you solve an inequality using addition?
    (This includes putting the solution in set notation, which we did not discuss in class.)


Assignments:

1) Chapter 2 Test Corrections Due Thursday
2) Solving Inequalities Part I Worksheet


Tuesday, October 15, 2019

Topics for October 15th

Today We Discussed:

We moved on to Chapter 3 today.  Our discussion has moved from equations where both sides are equal, to inequalities where one side is larger or smaller than the other.  We also discussed the difference between solutions where the endpoint is included vs excluded and explored the graphs of inequalities.  A solution to an inequality is any value that will make the inequality true.  Inequalities differ from equations because inequalities often have infinite solutions that are bound by a particular value whereas equations typically have a finite solution set.

Vocabulary: inequality, solution to an inequality

Sections Covered in Textbook:

3-1: Inequalities and Their Graphs (pages 134-138)


Resources & Tutorials:

1) What is an Inequality?
2) How Do You Graph Inequalities?
    (This video also includes infinite sets which we did not discuss.)


Assignments:

1) Chapter 2 Test Corrections due Thursday
2) Pages 136-138 #'s 1-31 odd; 51, 52, 58-63 all, 68, 73


Monday, October 14, 2019

Topics for October 14th

Today We Discussed:

Welcome back, students!  Today we continued our exploration of equations, but focused on literal equations and formulas.  Literal equations are just equations that have more than one variable.  Formulas are mathematical or scientific facts, rules, or relationships expressed with mathematical symbols.  Students have been using formulas for much of their mathematics studies, although they may not be aware.  In the last chapter, we used the formula for distance (d=rt) and also perimeter of a rectangle {P=2(l+w)}.

We can use our knowledge of solving equations to move variables around in literal equations or formulas, to solve for a particular variable.  The properties of equality (addition, subtraction, multiplication, division and distributive) still apply here in these examples.

The first step in any solving equation problem it to identify the variable that you are solving for.  Once that is done, we follow the reverse order of operations to isolate the variable, and follow the same steps we used for solving multi-step equations.  As a reminder, here are those steps again:


Vocabulary: formula, literal equation

Sections Covered in Textbook:

2-6: Formulas (pages 111-114)


Resources & Tutorials:

1) What is a literal equation?
2) How do you solve a formula for a variable?
3) Summary of solving literal equations.


Assignments:

1) Chapter 2 Test Corrections due Thursday
2) Literal Equations Worksheet