Today We Discussed:
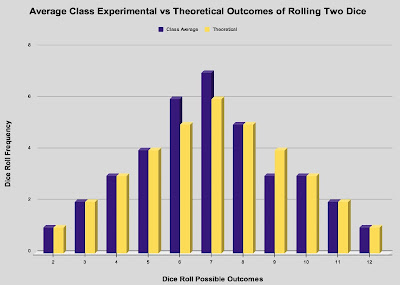
We continued our progress with our dice project, and learned how to create new charts from our collected data. For this project, we only focused on histograms/bar charts/column charts. The completed project will have two histograms that are outlined in the project packet.We also reviewed some practical uses of spreadsheets to gain better understanding of how and why they are used.
Finally, we discussed some of the things we learned by completing this project. Students were given a list of discussion questions that they should use to build their conclusion document to be included with the final project. We will spend some time in class tomorrow going over the discussion questions and comparing data with each other.
Sections Covered in Textbook:
None
Resources & Tutorials:
1) Class Notes: How to Create Charts in GSheets.2) How to create a column chart in GSheets (Video).
3) Dice Project Discussion Questions


No comments:
Post a Comment
Note: Only a member of this blog may post a comment.