Wednesday, December 8, 2021

Writing a Function Rule

Today We Discussed:

We continued our discussion about functions and explored how to write a function rule (basically this is an equation) from a table of values or a graph of coordinate points.  When we move deeper into linear functions, finding the slope, and graphing, we'll take a look at how to deduce a function rule that involves more than one operation.


Sections Covered in Textbook:

5-5: Writing a Function Rule (pages 254-260)


Resources & Tutorials:

1) How do you write a rule from a table? 
2) Finding the function rule from a table (more complicated examples).

Tuesday, December 7, 2021

Function Rules, Tables, and Graphs

Today We Discussed:

We expanded our work on functions today with an exploration of graphing.  We discussed three different ways to view a function (as an equation, as a table, and as a graph).  We played around with linear, absolute value, and quadratic functions.

One aspect of functions that is nice is that we can pick what values to use for our domain, and this is especially helpful when dealing with functions containing fractions.  We can pick numbers for the domain that multiply to give us whole numbers, to make our graphs easier to draw.  I will continue to reinforce to students to choose wisely when picking values for the domain.

We also discussed the generic shapes of the three types of functions we talked about.  Linear functions will create a line; absolute value functions will generate a "V"; quadratic equations will generate a "U" or what is called a parabola. 

Vocabulary: independent variable, dependent variable


Sections Covered in Textbook:
5-3: Function Rules, Tables, and Graphs (pages 247 - 252)


Resources & Tutorials:

1) How do you graph a linear function using a table?
2)  Graph an absolute value function from a table.
3)  Graph quadratic function from a table.
4) 6 Mini-Coordinate Planes for Graphing

Monday, December 6, 2021

Relations and Functions Part 2

Today We Discussed:

We expanded our discussion about relations and functions today and took a look at function notation.  Most students are intimidated by this method of representing an equation in two variables.  They are mostly comfortable with an equation of the form

y = 2x + 3 

We discussed that f(x) = 2x + 3 is just a fancy way of writing the above equation, and it can be described by saying "there is some function that uses the variable x, where the function rule is 2x+3". 

We discussed evaluating functions for given domain values, to produce range values.

DIXI-ROYD was also reinforced today.


Vocabulary:   DIXI-ROYD, function rule, evaluate function, function notation


Sections Covered in Textbook:

5-2: Relations and Functions (pages 241-246)


Resources & Tutorials:

1) What is function notation?
2) How do you find f(x) if given a value for x?

Thursday, December 2, 2021

Relations and Functions Part 1

Today We Discussed:

Today we explored what relations are, and discussed the concepts of domain and range.  We also defined functions as special relations where there is exactly one range value for each given domain value.  We modeled the different ways of representing a relation:  set of ordered pairs, table, mapping diagram, and graph, and used the vertical line test to determine if a graph is a function or not.  We also discussed why graphs that fail the vertical line test are not functions.


Many students will try to "force" a relation to be a function, or will feel like it is "bad" if a relation is not a function.  We discussed this tendency, and why it's perfectly fine to have a relation that is not a function.  Just because something does not fit a particular definition does not make it bad or good - it just is what it is!

Vocabulary:  relation, domain, range, function, vertical line test, mapping diagram, 


Sections Covered in Textbook:

5-2: Relations and Functions (pages 241-246)


Resources & Tutorials:

1) What is a relation?
2) What is domain?
3) What is the range of a relation?
4) How do you find the domain and range of a relation?
5) What is a function?
6) How do you figure out if a relation is a function?

Wednesday, December 1, 2021

Relating Events to Graphs

Today We Discussed:

We began our next unit on functions and graphs.  Today we related graphs to real events, by analyzing graphs that relate to time passing.  The shape of the graph can tell a story of what is happening as time passes.

For graphs in general, we will be talking about independent and dependent variables.  Time is considered an independent variable with other variables dependent upon it.

Image result for interpreting graphs of time

Projects are due tomorrow.  Check yesterday's blog for a list of all items that should be included.  NO LATE PROJECTS will be accepted.

Sections Covered in Textbook:

5-1: Relating Graphs to Events


Resources & Tutorials:

1) Relating Graphs to Events
2) Relating Graphs to Events - another video

Tuesday, November 30, 2021

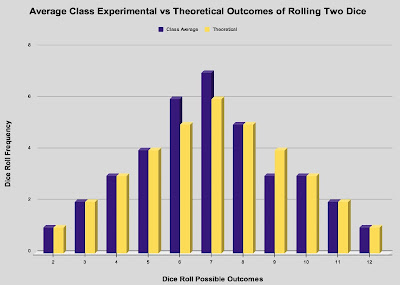
Dice Project - Finishing Up

Today We Discussed:

We used today's class to finish our discussion about probability, and to work on finishing projects.  All students are encouraged to type their conclusions using Google Docs.  Reminder, the finished project should include the following items:

  • Rubric
  • Printout of Data from 3 Trials of Rolling Dice
  • Summary of Trial Data
  • Frequency Tables (4)
  • Theoretical Outcomes
  • Histogram Containing 3 Trials
  • Histogram of Trial Averages vs Theoretical Outcomes
  • ThinkSheet
  • Written Conclusion (Typed preferred)
Ms. Dause worked with students during study hall on how to effectively write a project conclusion.  

Sections Covered in Textbook:

None


Resources & Tutorials:

1) Project Packet (if needed)
2) Discussion Questions (if needed)


Monday, November 29, 2021

Dice Project - Chart Work Day

Today We Discussed:

We continued our progress with our dice project, and learned how to create new charts from our collected data.  For this project, we only focused on histograms/bar charts/column charts.  The completed project will have two histograms that are outlined in the project packet.


We also reviewed some practical uses of spreadsheets to gain better understanding of how and why they are used.

Finally, we discussed some of the things we learned by completing this project.  Students were given a list of discussion questions that they should use to build their conclusion document to be included with the final project. We will spend some time in class tomorrow going over the discussion questions and comparing data with each other.  

Sections Covered in Textbook:

None


Resources & Tutorials:

1)  Class Notes:  How to Create Charts in GSheets.
2)  How to create a column chart in GSheets (Video).
3)  Dice Project Discussion Questions