Topics for Today:
It may have been some time since you had to perform long division, and long division is a multi-step process like so many we have seen in Algebra. If you follow the procedure, you will arrive at your answer (quotient). The process for dividing polynomials is similar to long division of constants.You should recall from earlier mathematics courses that the process for long division is as follows:
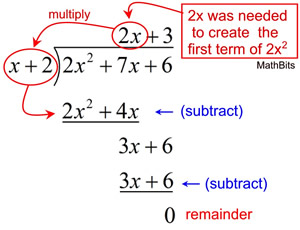
- Figure out how many whole times the divisor divides into the dividend and place that number on top of the divisor.
- Multiply this number by the divisor, and subtract this number from the dividend.
- Bring down the next number in the divisor.
- Repeat until you have no more numbers in the dividend to bring down.
- If your final subtraction problem results in "0", you have no remainder; otherwise, your remainder is a part of a whole and should be represented as a fraction with the remainder number in the numerator, and the divisor in the denominator.
---> When dividing polynomials by a binomial, we will look to the variable part of the binomial to make our decision on what divides into the dividend.
Sections Covered in Textbook:
12-5: Dividing Polynomials (pages 662-666)
Resources & Tutorials:
1) Review of Long Division2) Dividing Polynomials (long division)
3) Cool Math - Dividing Polynomials Examples (not a video)


